Cartographic Encoding and Accessible Maps
A map is an argument made with position, shape, size, color, texture, and text. Good cartography starts with the reader's question and the data contract—not with a palette. A locator map, an analytical choropleth, and an operational routing map need different encodings even when they use the same geometries.
Prerequisites
Complete distance, area, and nearest neighbors. You should know the geometry support, CRS, extent, and uncertainty before deciding how to draw a layer.
Learning goals
- Match categorical, ordered, diverging, and quantitative variables to honest visual encodings.
- Supply a title, direct labels, units, legend, source, and scope that make the map interpretable.
- Use contrast plus redundant shape, pattern, or text so meaning is not color alone.
- Write alternative text that communicates the map's purpose and important spatial pattern.
Encode the question
Use hue for unordered classes, an ordered lightness sequence for magnitude, and a diverging scale only when a defensible midpoint matters. Area and length are harder to compare than position, so proportional symbols need a clearly stated size rule. Class breaks can change the apparent pattern; publish the method and counts, and inspect whether small changes move many observations across a boundary.
A legend is part of the model. It must name the variable, units, missing-data symbol, categories, and any transformation. Labels should identify important places directly and avoid collisions that hide data. North arrows and scale bars are useful only when their assumptions are valid; they do not repair an unsuitable projection.
Accessibility is a data-delivery requirement. Ensure text and essential graphical objects have sufficient contrast, use labels or patterns in addition to color, preserve a logical reading order, and provide a concise text equivalent. Alternative text should state the map's purpose, geography, encodings, and main takeaway; surrounding prose or a data table should carry details that cannot fit naturally in the alt text.
Worked example
The local map uses color, hatch pattern, inline W/E labels, polygon outlines, and a text legend. The second district's missing fixture label is repaired only in the presentation layer; the source fixture remains unchanged.
import json
from pathlib import Path

import geopandas as gpd
import matplotlib.pyplot as plt
from matplotlib.patches import Patch

fixture = Path("tests/fixtures/geospatial-data-science")
document = json.loads((fixture / "districts.geojson").read_text(encoding="utf-8"))
districts = gpd.GeoDataFrame.from_features(document["features"], crs=document["metadata"]["crs"])
styles = {
    "west": {"facecolor": "#0072B2", "hatch": "///", "label": "West district", "mark": "W"},
    "east": {"facecolor": "#E69F00", "hatch": "...", "label": "East district", "mark": "E"},
}

fig, ax = plt.subplots(figsize=(7.2, 4.0), dpi=120)
for row in districts.itertuples():
    style = styles[row.district_id]
    gpd.GeoSeries([row.geometry], crs=districts.crs).plot(
        ax=ax, facecolor=style["facecolor"], edgecolor="#111111",
        linewidth=2, hatch=style["hatch"], alpha=0.82,
    )
    point = row.geometry.representative_point()
    ax.text(point.x, point.y, style["mark"], ha="center", va="center", weight="bold",
            color="#111111", bbox={"facecolor": "white", "edgecolor": "#111111", "pad": 3})
handles = [Patch(facecolor=value["facecolor"], edgecolor="#111111", hatch=value["hatch"], label=value["label"])
           for value in styles.values()]
ax.legend(
    handles=handles, title="District (color + pattern)", loc="upper center",
    bbox_to_anchor=(0.5, -0.18), ncols=2,
)
ax.set(title="Synthetic teaching districts", xlabel="Longitude (degrees)", ylabel="Latitude (degrees)")
ax.set_xticks([13.38, 13.39, 13.40, 13.41, 13.42])
ax.set_aspect(1 / 0.61)
fig.tight_layout()
output = Path("static/img/geospatial-accessible-district-map.png")
fig.savefig(output, bbox_inches="tight", pad_inches=0.15, metadata={"Software": "DataScienceBase"})
plt.close(fig)

def luminance(hex_color):
    channels = [int(hex_color[index:index + 2], 16) / 255 for index in (1, 3, 5)]
    linear = [value / 12.92 if value <= 0.04045 else ((value + 0.055) / 1.055) ** 2.4 for value in channels]
    return 0.2126 * linear[0] + 0.7152 * linear[1] + 0.0722 * linear[2]

contrast = (luminance("#ffffff") + 0.05) / (luminance("#111111") + 0.05)
print("legend=West district|East district labels=W|E redundant_encoding=hatch+label")
print(f"contrast_min={contrast:.2f}:1 asset={output.name}")
Expected output:
legend=West district|East district labels=W|E redundant_encoding=hatch+label
contrast_min=18.88:1 asset=geospatial-accessible-district-map.png
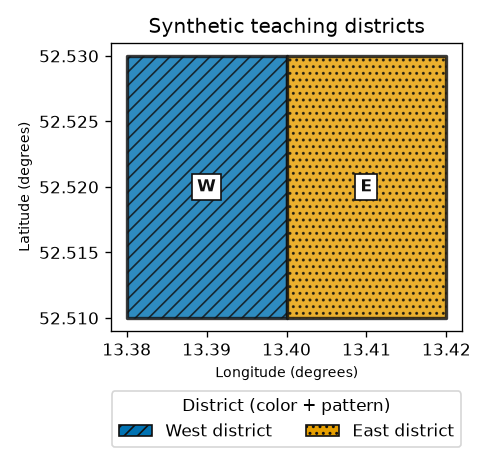
The reported ratio checks the dark outlines and label text against white, not every possible pair in the figure. Contrast testing must cover actual adjacent colors and text sizes in the delivered page. The map remains understandable in grayscale because district identity is repeated by position, pattern, label, outline, legend, and alternative text—not color alone.
Limitations and common mistakes
- A perceptually uniform palette does not make unsuitable data, class breaks, or aggregation honest.
- Red–green avoidance alone is not an accessibility review; low vision, zoom, keyboard access, and screen-reader context also matter.
- A basemap can add visual noise, licensing obligations, stale labels, and network dependence.
- Dense labels, decorative 3D effects, and area-scaled symbols can distort comparison.
- Do not describe uncertainty only in a caption if it changes the map's interpretation.
Practice
Redesign the example for a grayscale printout and for a screen reader. Write a title, a two-sentence text summary, and a table with district identity. Then state which information is carried redundantly and which details still require surrounding prose.
Next steps
Next, read raster bands, resolution, and NoData as one inseparable measurement contract.
Primary sources
Checked 2026-10-18: W3C WAI, do not use color alone and provide sufficient contrast; W3C WCAG technique G111: use color and pattern; Matplotlib, choosing colormaps; W3C WAI, images and alternative text decision tree.